
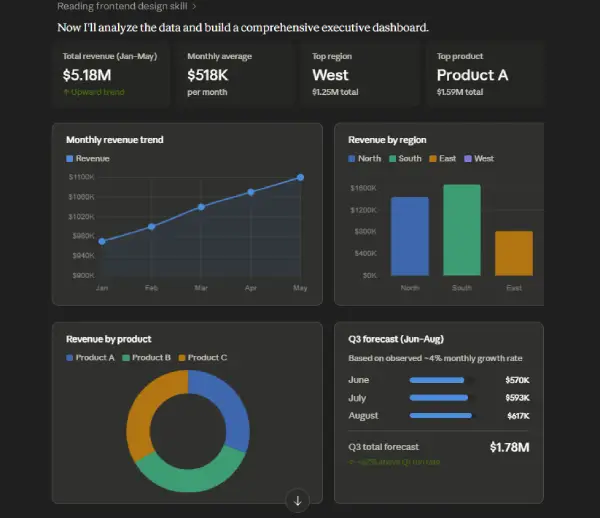
Manually analysing Excel and Google Sheets datasets can eat up hours of your time. You’ll need to clean it up, organize it properly, run formulas, create summaries with PivotTables, and turn it all into something visual. Claude AI can actually help you breeze through all of this with right prompt and you’re done in minutes instead of hours. You will get the result like the screenshot shown below.
You can use my Claude AI prompt to analyze sales and revenue data from Excel or Google Sheets. This prompt is ideal for forecasting, strategic planning, and regional performance evaluation.
This prompt works well if you’re tracking sales trends, monitoring performance by region, generating reports, or preparing data for visualization. Simply paste your dataset, and Claude will help you uncover patterns and insights.
Table of Contents
Claude AI Prompt to Analyze Excel/Google Sheets Dataset
The prompt given in this article works best with structured, tabular Excel/Google Sheets data.
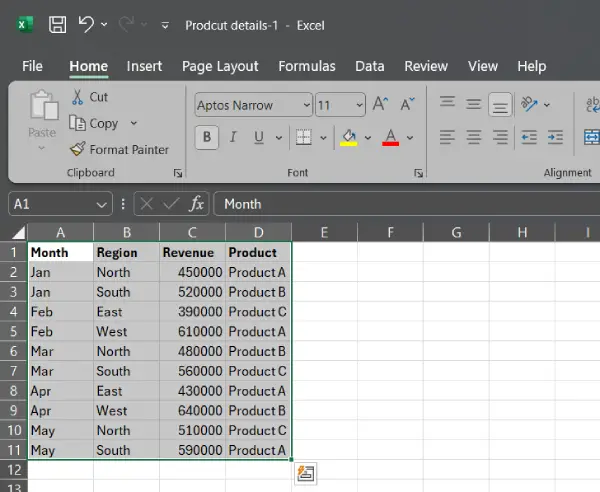
For this guide, I have used an Excel data that tracks revenue performance across different months, regions, and products. Each row represents a single transaction or reporting unit showing how much revenue was generated by a specific product in a specific region during a specific month.
The data spans 5 months (January through May 2026) and covers 4 geographic regions with 3 different products.
1. First, copy all data from your Excel or Google Sheets (Press Ctrl + A and press Ctrl + C).
2. Now, go to Claude AI website and login with your account (No premium plan is required).
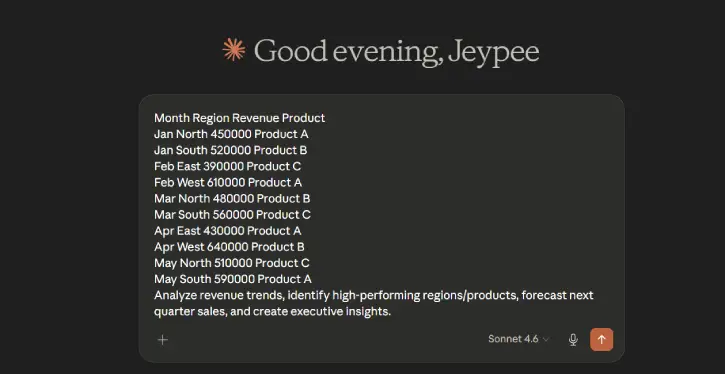
3. Paste (Ctrl + V) the copied data in the chat box.
4. Press the Shift key and the press Enter to go to the next line.
5. Now, copy and paste the below prompt and press Enter.
Analyze revenue trends, identify high-performing regions/products, forecast next quarter sales, and create executive insights.
6. Claude will take one or two minutes to analyze the data and bring comprehensive report, including the data visualization (see the screenshot on top).
ALSO READ: Excel VLOOKUP, HLOOKUP, XLOOKUP Differences, Syntax and Use Cases
You can use this Claude AI prompt for:
- Sales analysis — comparing performance across regions and products
- Trend tracking — identifying growth or decline over time
- Reporting — presenting business metrics to stakeholders
- Data visualization — creating charts or dashboards to spot patterns
Benefits of this Claude AI Prompt
- Forecast
- Strategic planning
- Region Performance
The below video shows how it works:
Conclusion
By leveraging Claude AI for spreadsheet analysis, you’re not just saving time, you’re unlocking insights that might otherwise stay buried in rows and columns. Whether you’re a solopreneur managing a small business or an analyst supporting a large team, this approach transforms raw data into actionable intelligence in minutes, freeing you up to focus on strategy instead of spreadsheet grunt work.
Try it with your next dataset and see how much faster your decision-making becomes.