
Ever calculated an average only to realize it’s completely skewed by one or two weird numbers? That’s what happens when you’re tracking monthly bills in Excel or LibreOffice Calc and one month you splurge on something unexpected, or you get an unusually good deal another month. The average ends up being misleading because it doesn’t actually represent what you typically spend.
This is where TRIMMEAN becomes your best friend. Both LibreOffice Calc and Microsoft Excel support this function, and it’s designed specifically to give you a more realistic picture by cutting out those pesky outliers.
Table of Contents
How TRIMMEAN Works in Excel/LibreOffice Calc
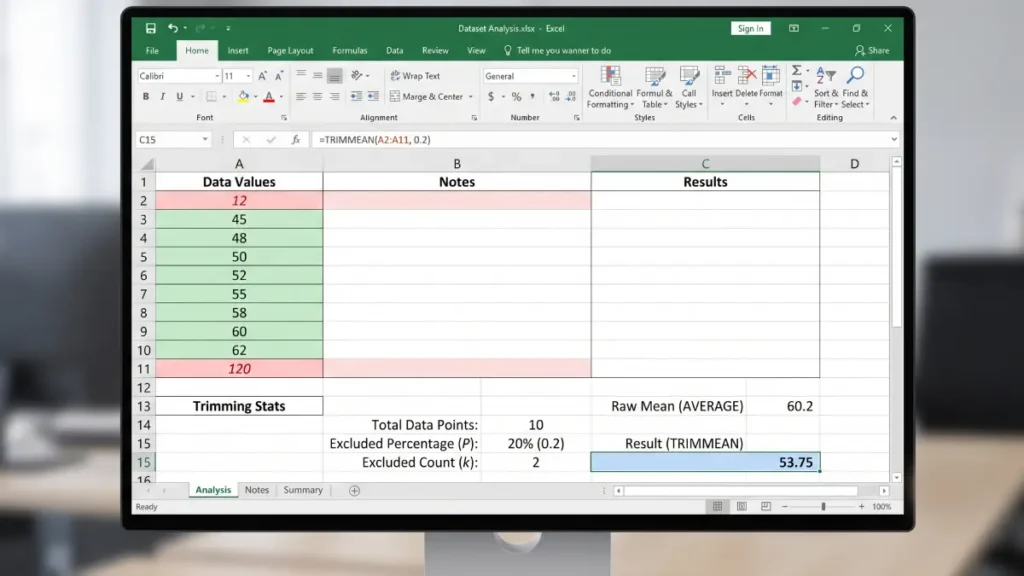
The TRIMMEAN function calculates the average of a dataset after excluding a specified percentage of data points from the top and bottom tails. This is incredibly useful for eliminating outliers (like abnormally high or low scores) that could skew a standard average.
Formula Syntax: =TRIMMEAN(range, percentage)
- array: The range of cells containing the numbers.
- percent: The fractional proportion of data points to exclude. For example, 0.2 means trim 20% total (10% from the lowest values and 10% from the highest values).
Here’s a real-world example:
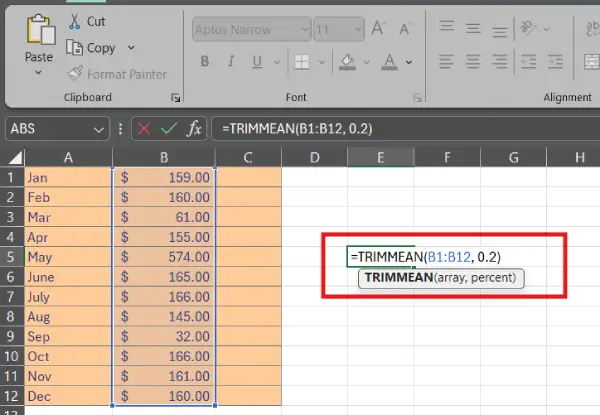
Say you’re tracking your monthly expenses in cells B1 to B12. Most months hover around $160, but the May hit $574 (unexpected car repair) and September dropped to $32 (you were on vacation and barely spent anything). These two months throw off your entire average.
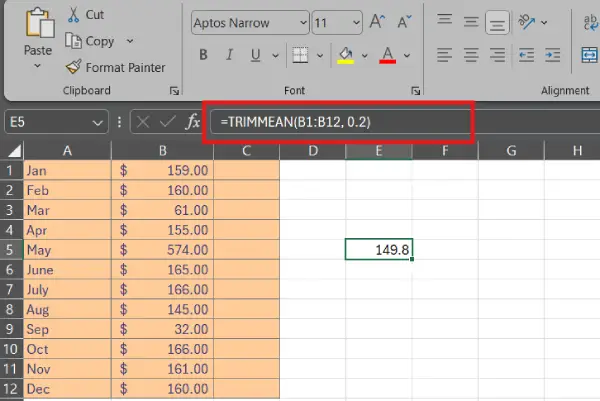
Using =TRIMMEAN(B1:B12,0.2) tells the spreadsheet to exclude 20 percent of your data—specifically, the top 10 percent and bottom 10 percent.
In this case, that removes your highest outlier and lowest outlier, leaving you with a realistic average of $149. Without it, you’d get $175, which doesn’t actually reflect what you spend in a typical month.
How to Choose Your Percentage
The percentage parameter gives you control over how aggressively you want to trim. Here’s how it breaks down:
- 0.1 removes 10 percent (5 percent from the top, 5 percent from the bottom)
- 0.2 removes 20 percent (10 percent from each end)
- 0.3 removes 30 percent (15 percent from each end)
Which one you choose depends on how many outliers you’re dealing with. If you only have a couple of weird numbers, 0.1 or 0.2 usually works well.
If your data is messier, you might go higher. Just remember that the higher the percentage, the more data you’re excluding, so don’t get too aggressive or you’ll lose meaningful information.
Conclusion
If you’re tired of averages that don’t feel representative of your actual situation, TRIMMEAN is a game-changer. Whether you’re analyzing expenses, sales figures, or any other data that tends to have occasional spikes or dips, this function gives you the realistic middle ground you’re looking for. It’s one of those hidden features that makes spreadsheet work feel less like fighting with your numbers and more like actually understanding them. Give it a try the next time you’re frustrated with an average that just doesn’t add up.