

Using ChatGPT, you can easily create a business dashboard in Google Sheets that tracks everything. It does not require any coding or expensive tools. Both ChatGPT and Google Sheets are free. With ChatGPT prompts, you can build dashboards that track everything.

This is particularly useful for solopreneurs, freelancers, agencies, coaches, creators, and other small businesses. You can create a dashboard tab in Google Sheets to track revenue by product, generate a monthly growth chart, design a layout to track traffic or lead sources, and track business progress and more.
Below are the ChatGPT prompts to create a business dashboard in Google Sheets. Copy the prompt, paste it in to ChatGPT, copy the suggested layout into Google Sheets, and customize it for your business.
Table of Contents
Your Prompt to Create Business Dashboard in Google Sheets
[Prompt]Act as a data dashboard expert. Build a Google Sheets layout that tracks key business metrics for a [Business type]
Include:
Revenue
Expense
Profit
Lead generation
Conversion rates
Monthly goal
Format: Sheets tabs + formula suggestions + chart ideas.
You can use below prompts to monitor your business growth in Google Sheets.
1. Track revenue by product
[Prompt]
Create a dashboard tab that tracks revenue by product or service. Include: Product name, monthly sales, price and total earned.
2. Visualize monthly growth
[Prompt]
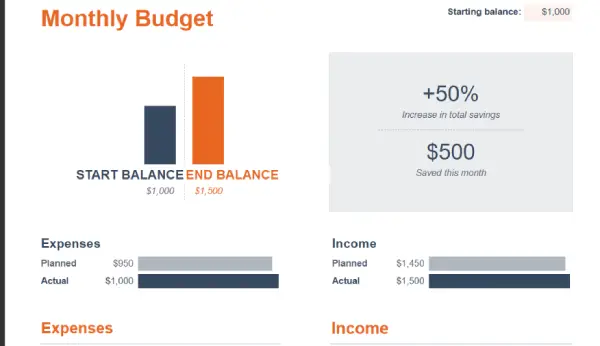
Generate a chart in Google Sheets that shows monthly revenue vs expenses. Include growth rate % automatically.
3. Traffic source tracker (For content creators and digital marketers)
[Prompt]
Design a layout to track traffic or lead sources (e.g. Twitter, Instagram, Email). Include UTM input and conversion tracking.
4. Lead gen dashboard
[Prompt]
Create a sheet to track new leads per day/week/month with columns for lead source, status, and outcome.
5. Goal progress Tracker
[Prompt]
Add a tab that tracks progress toward 3 business goals with % completion, milestone, and visual bar charts
Note: ChatGPT provides suggestions, not perfect formulas. Users may need to adjust based on their data structure.
Pro Tips for Google Sheets Users
Use Data Validation for Consistency
Create dropdown menus for fields like “Lead Source” or “Product Category.” This prevents typos and makes filtering/pivoting data cleaner. Go to Data > Data Validation and set rules.
Leverage Conditional Formatting
Highlight cells based on thresholds (e.g., turn revenue cells green if they exceed monthly goals, red if below). This gives you instant visual feedback without reading numbers.
Create a Master Summary Tab
Use IMPORTRANGE() or VLOOKUP() formulas to pull key metrics from detail tabs into a single overview dashboard. Update it once, and it refreshes automatically.
Schedule Weekly Reviews with Mobile Alerts
Set up Google Sheets notifications or sync your dashboard to Google Data Studio for mobile access. Review metrics every Sunday to stay accountable.
Use Named Ranges for Complex Formulas
Instead of writing =SUM(B2:B50), create a named range called “MonthlySales” and write =SUM(MonthlySales). This makes formulas readable and easier to maintain.
Build a “Notes” Column for Context
Numbers alone don’t tell the full story. Add a notes column to explain spikes or dips in metrics (e.g., “Ran Instagram ad campaign” or “Product launch delay”).
Conclusion
Business dashboards don’t need to be complicated or expensive. With ChatGPT and Google Sheets, you can build a powerful tracking system in minutes. No coding required. The key is starting simple: pick one metric that matters most to your business, create a basic dashboard, and iterate as you grow. Whether you’re tracking revenue, leads, or traffic, these tools give you the visibility you need to make faster, smarter business decisions. The real competitive advantage isn’t the dashboard itself, it’s using it consistently to spot trends and adjust your strategy.

